
As you probably know by now, the kind of food we choose to eat has a major impact on climate change, deforestation, pollution, biodiversity losses, water use, and food security. We’ve all received the message that eating plants is better than eating meat. But the extent to which our various food options – protein-rich foods in particular – impact these environmental and social issues has, surprisingly, not been well-covered by the media. These details are obviously important for people who want to reduce their impact on the planet, but can’t immediately switch to a vegan diet (which includes most people). This post will help you see where the biggest differences can be made and to decide between animal-based foods such as cheese versus eggs.
So basically what I’m going to do here is to translate the best science into easy-to-grasp charts that show the environmental impacts of different foods. In my next post, I plan to describe the environmental issues in more detail – the major threats to life on Earth known as Planetary Boundaries. But for now, it’s enough to know that food production (agriculture) is a major factor in almost every major environmental challenge that we face, as we’ll see below.
A note about the data from Poore and Nemecek
The data in the charts below comes from a 2018 paper Reducing food’s environmental impacts through producers and consumers, published in Science by two Oxford University scientists, Poore and Nemecek. It’s the most widely cited and respected research on this topic, to date.
If you do an internet search on the carbon footprint of various foods, you’ll most likely come across a chart from Our World in Data. That chart uses a subset of the data from the same Poore and Nemecek paper that does not include the footprint of wasted food. My chart does include Poore and Nemecek’s adjustment for food waste and correspondsto the data shown in the main figure of their paper. (The raw data is in file aaq0216_datas2.xls, provided here.)
Including an adjustment for food waste is important because it gives a more accurate picture of the environmental footprints but also, importantly, because the amount of waste varies considerably per food type. As the authors pointed out in their paper, “wastage is high for fresh animal products, which are prone to spoilage.” You’re much more likely to allow milk or meat to go off than some dried legumes – even more so for supermarkets, which cannot sell meat or dairy beyond a limited time period. Including the adjustment for wasted food increases the estimated carbon footprint of beef from 60 kg to 100 kg of CO2 (per kg of beef).
Ok, so let’s get to the data, starting with the carbon footprint!
The carbon footprint of meat and other foods
In these charts, I’m focusing on animal-based food products and the plant-based alternatives that we are most likely to eat as meat or dairy substitutes. In other words, they are the foods that are fairly rich in protein. It should be noted that most common fruit & veg (bananas, citrus, root veggies, brassicas, etc.) would be found at the low end of the spectrum on the charts below, and are among the best choices for your diet. I didn’t include them on the charts so that we can focus on protein-rich foods, where our choices make the biggest difference.
The first chart, below, shows the global average carbon footprint of various meats and protein-rich plant foods, expressed as greenhouse gas (GHG) emissions per kilogram of product.
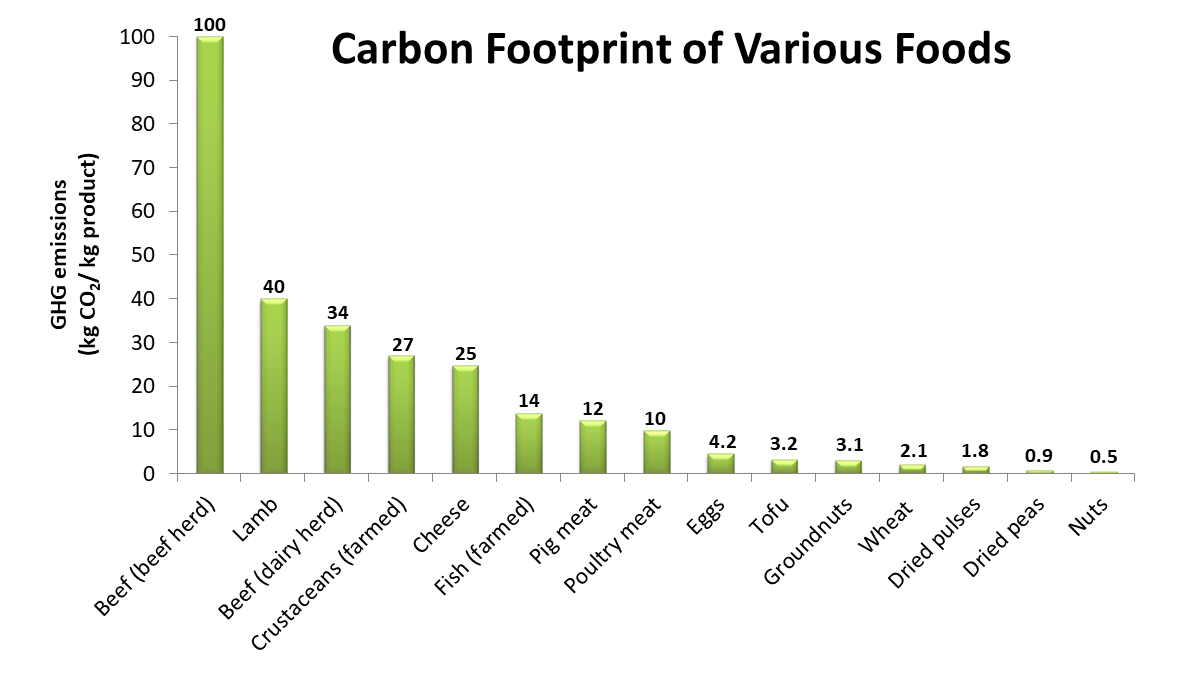
The carbon footprint of 1 kg of beef from a cattle farm (where most beef cuts come from) is an astonishing 100 kg CO2. Lamb and beef from a dairy farm (often sold as ground beef) have footprints of 40 and 34 kg CO2 per kg of meat, respectively.
The carbon footprint of pork is 12 kg CO2 per kg meat while poultry (chicken, mainly) averages around 10 kg CO2 per kg meat. Per kg of product, packaged tofu has a carbon footprint of 3.2 kg CO2, pulses such as lentils are below 2 kg, peas are below 1 kg and nuts (surprisingly) are below 0.5 kg.
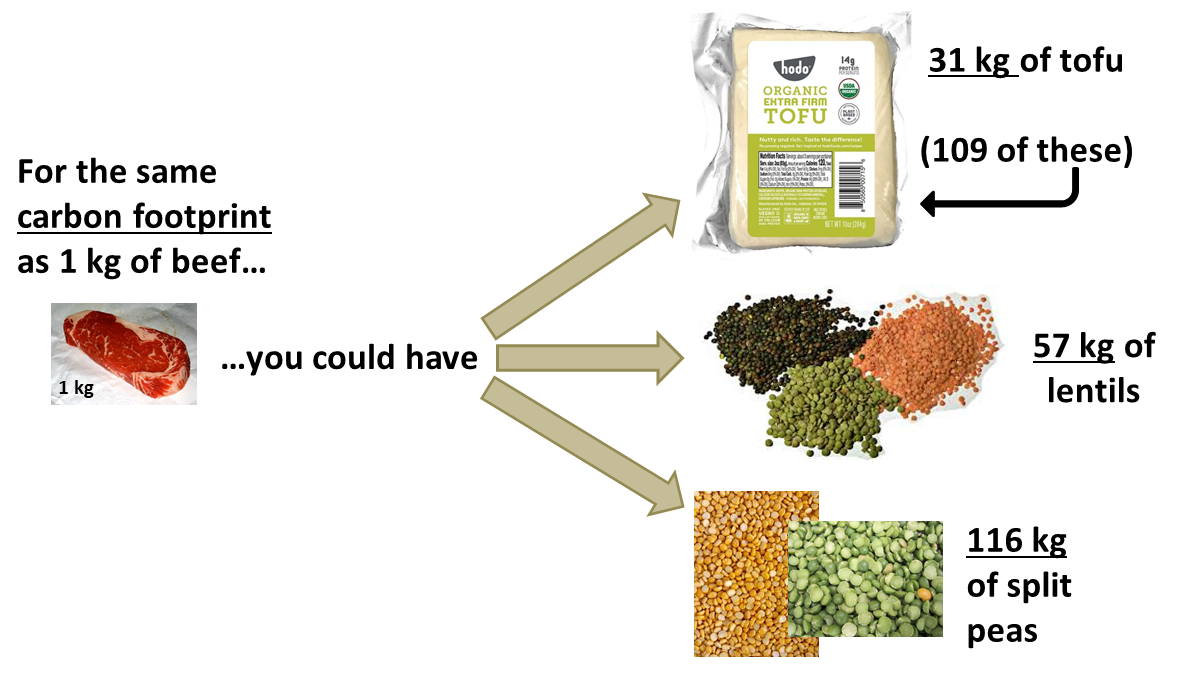
So for the same carbon footprint as 1 kg of beef (from a beef herd) you could have 31 kg of tofu, 57 kg of lentils or 116 kg of dried peas, respectively. That would be enough of any of these three plant foods to sustain you for about a year, providing 14, 34, or 70 grams of protein per day, respectively. This is not a fantasy – billions of people around the world sustain themselves on these foods daily – dal and other dishes made from dried legumes (India, Nigeria), tofu (East Asia), beans (South America), etc.
For those who aren’t confident in their cooking skills, you can buy products made from legumes that are simple to cook. I’ve been highlighting many of them on this blog (and Ethical Bargains): meat substitutes such as Beyond Meat (made from pea protein), pasta made from legumes, etc.
Two surprising carbon footprints: cheese and nuts
I was surprised by the carbon footprint of cheese – averaging 25 kg CO2 per kg of cheese – I was not expecting it to be this high. As discussed in a previous post on the ethics of dairy farming, the more I learn about dairy the less I want to eat it. I used to take cheese for granted and actually find it boring when you eat a lot of it. Now it’s a rare treat and I enjoy it a lot more because of that.
Then there’s nuts – an average carbon footprint of only 0.5 kg CO2 per kg product – crazy! I’ll return to nuts later as there are nuances between different kinds of nut. And, as you are probably already recalling, the water footprint of nuts can be very high. Peanuts are evaluated separately to tree nuts and are listed as groundnuts in these charts – roasted peanuts are actually very rich in protein, by the way, at around 26%.
A tale of two proteins: eggs and wheat
You probably think of eggs as a source of protein while wheat (bread) is a carb, but they actually contain around the same about of protein – around 12% by weight. So a 50 g egg provides 6 grams of protein, as would a 50 g slice of sourdough bread.
The carbon footprint of eggs was estimated to be around 4.5 kg CO2 per kg of eggs (that’s around 20 eggs). That’s the lowest carbon footprint of all the animal products – you could have around 450 eggs for the same carbon footprint as 1 kg of beef from a cattle ranch. I’ll need to do a feature on the ethics of eggs someday as I’ve never covered this topic before. I have researched it already (for my upcoming book) and can share what I have as a comment below if you’d like to know a little more.
Whole grains are rarely considered as a source of protein, and that’s a shame really. I probably eat around 200 grams of bread daily (preferably sourdough, seeded, or whole wheat) and that provides almost half my protein needs (26 grams). On other days I’ll have something with oats – overnight oats, muesli, granola, etc. Note that the footprint data for wheat in these charts is actually for bread, so the footprint of baking, packaging, shipping, etc., is already included.
There are also several meat substitutes made from wheat protein such as seitan, Tindle vegan chicken tenders and Sweet Earth vegan bacon.
More perspective on the carbon footprint of beef
Of the materials we use in everyday life, it’s hard to find any that have a carbon footprint, per kg, as high as beef. Of our commonly used materials, aluminium stands out as having one of the largest carbon footprints, averaging around 16 kg CO2 per kg of metal produced. And yet aluminium is highly recyclable and the carbon footprint of recycled aluminium is way lower than that of virgin metal. Beef’s footprint eclipses that of aluminium and yet is only used once.
Here’s a good way of putting the carbon footprint of beef in perspective:
If we imagine that everyone on the planet eats 1 lb. of beef per week, our collective carbon footprint – just for this beef – would be 19 billion tonnes of CO2. Current global GHG emissions are around 59 billion tonnes of CO2 per year, so the beef would increase the planet’s emissions by almost one third. Beef consumption per capita in the US is already over 1 lb. per week – if the whole world followed suit, we would be effectively closing the book on our future. – Upcoming GSP book, currently seeking a publisher 😉
The carbon-footprint of fish: what about wild-caught fish, farmed bivalves?
The carbon footprint of farmed fish is quite high here (14 kg CO2 per kg fish) and crustaceans are even higher (27 kg CO2). This is very relevant, especially with crustaceans (shrimp/prawns) being one of the most popular kinds of seafood.
However, Poore and Nemecek didn’t evaluate other kinds of seafood so I’ll refer you to my post on the most sustainable kinds of seafood which is based on a different paper (Bianchi et al., 2022). That study looked at fish in much more detail and also found farmed fish to have high carbon footprints, with one exception – farmed bivalves (mussels, oysters, clams, cockles, and scallops). The practice of farming kelp near the ocean surface and then bivalves underneath was featured as one of the most positive food system developments in the otherwise mediocre Food, Inc. 2.
Of the wild-caught fish, Bianchi found crustaceans to have very high carbon footprints while small pelagic fish (sardines, herring, mackerel, anchovies, etc.) and salmonids (salmon, trout, char) had the lowest. Of course, there are other considerations too – mainly the health of native fish stocks that are impacted by overfishing and bycatch. Small pelagic fish are less prone to bycatch issues but can be overfished so seek out a sustainable fish certification.

I know you may be running out of steam, reading this article, but I want you to be able to make an informed decision by the end of it. So rather than a long discussion on the next four environmental impacts, I’ll briefly show the charts and then do a deeper dive on each topic in future posts and link to them from here.
The land footprint of meat and other foods
This chart below pretty much speaks for itself – beef and lamb have massive land footprints, compared to most other foods. Beef from a dairy herd has a lower land footprint than beef from a beef herd (cattle ranch). Beef from dairy cows is usually sold for lower-grade applications (ground beef or stewing meat) but that actually might change as some have been raving about the quality of organic dairy cow meat.

I’m going to do another article on this but briefly, the land footprint of our food has a huge impact on the following:
- Deforestation: New agricultural land has to come from somewhere, and it’s often at the expense of tropical forests. Agriculture for growing animal feed or direct grazing is the major cause of Amazon deforestation. I’ll come back to this in my next post on Planetary Boundaries.
- Biodiversity: Agricultural land is not a good habitat for most creatures – even transitory creatures such as migratory birds and pollinators can be killed when they have limited options besides pesticide-laden seeds or pollen. Cattle require large amounts of feed, which is typically grown under intensive conditions. Also most of the Earth’s species live in the forests that are being deleted for beef production.
- Food Security: As people eat more meat the extra land that we need for production threatens our ability to feed the human population. The combined impacts of population growth and climate change will put enormous stress on our food system unless we reduce meat consumption.
Of the animal-based products, eggs have the lowest land footprint, and fish too (although regular fish farms do have a land footprint, mainly from growing fish food, that’s not far off that of poultry). Cheese is up there again with a large footprint, on a global average. So based on the two critical environmental impacts – GHGs and land usage – vegetarians could reduce their individual footprint by choosing eggs over cheese.
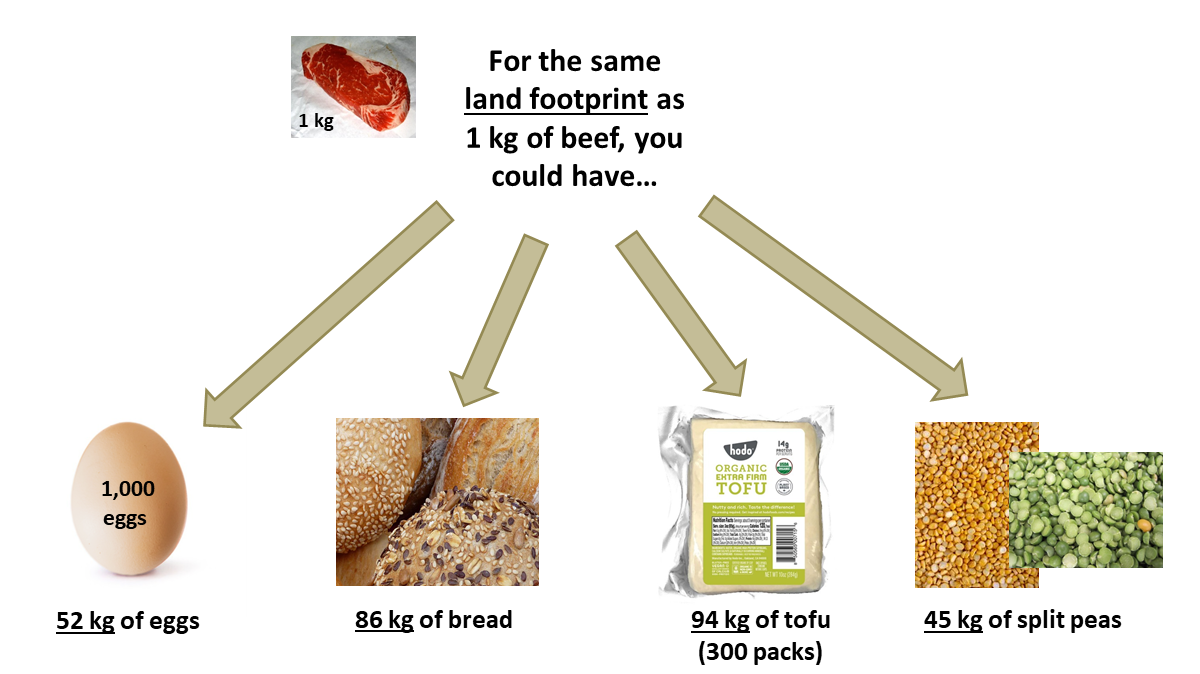
But if there’s only one thing to remember from this section it’s that beef and lamb have massive carbon footprints. For the land footprint of 1 kg of beef you could have 52 kg of eggs (over 1000 eggs), 86 kg of bread (more than a year’s supply), 94 kg of tofu (enough for several years), or 45 kg of split peas (enough to make dal every day for a year).
Another note on land use: because land use to produce eggs and poultry meat is low, it’s feasible to have pasture-raised operations and still feed the human population. With beef, this is not possible without further deforestation – it has to be intensive operations. I’ll discuss this a little more in a few weeks. Still three footprints to go!
The water footprint of meat and other foods
Here’s the water footprint of the same set of foods, adjusted for water scarcity. Including a correction for water scarcity is a way of recognizing that heavy water use for agriculture is more problematic in a dry region than in a wet region. I also examined Poore and Nemecek’s data on absolute freshwater use (not weighted for scarcity) and the picture is not that different to the graph below except that the animal products look a little worse.
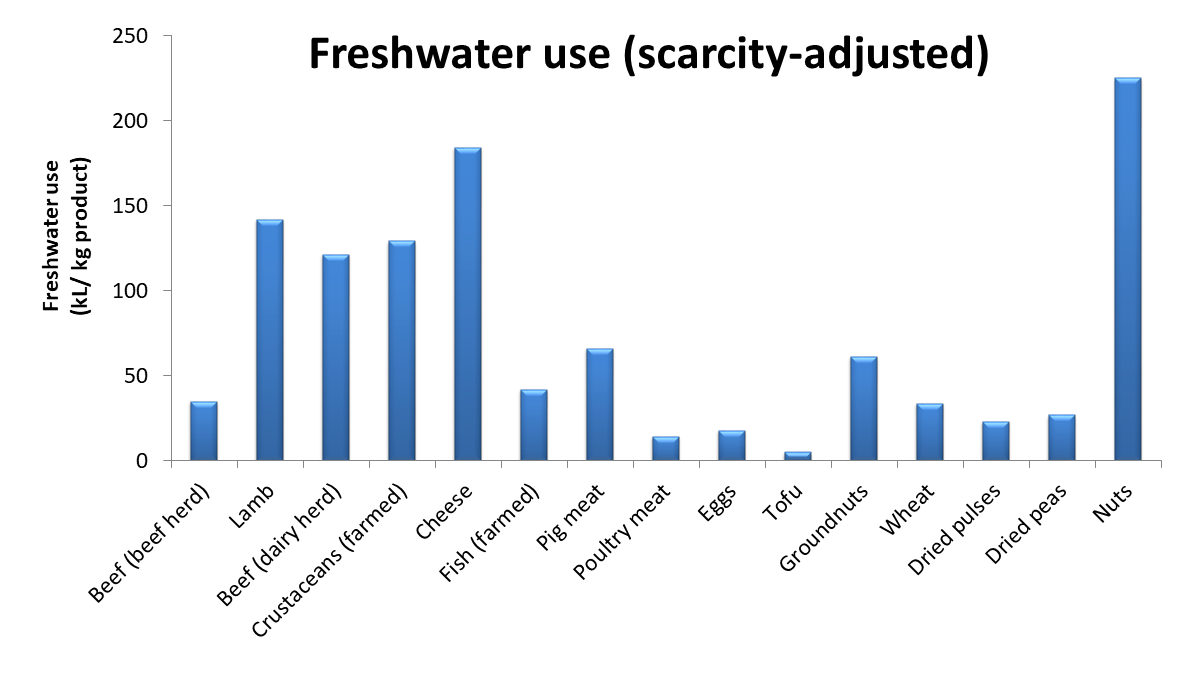
The high water footprint of nuts has received a lot of attention so it shouldn’t come as a surprise here. However, since nuts have much lower carbon and land footprints compared to cheese and most meats, some perspective is needed here. A moderate intake of nuts, ideally with preference given to those with lower water footprints (another topic for a future post), seems reasonable. Mix in some groundnuts such as peanuts or even Bambara nuts, which I’ve written about on Ethical Bargains
Bambara can be grown in arid regions due to its drought and heat tolerance and also on marginal land that’s not suitable for other forms of agriculture. Being a legume, it can fix nitrogen from the air and also help regenerate the poor soil systems that it’s capable of growing in. – Review of Bambara nut milk from WhatIF Foods.
Most animal products have large water footprints, with eggs, poultry meat and obviously wild-caught fish (again, not covered in this study) looking best. Farmed fish have much larger freshwater footprints, compared to wild-caught fish, as they require feed.
The pollution (eutrophication) footprint of meat and other foods
Eutrophication is a form of pollution in which water bodies become excessively enriched by nutrients, resulting in algal blooms that deprive fish of oxygen. Fertilizer from agriculture and animal waste are the major sources of this pollution – running off land into rivers, lakes and oceans. It’s a major problem, being one of the Planetary Boundaries considered to be in the danger-zone (to be discussed in the next post).
The chart below shows the eutrophication footprint of various foods (global average), again from Poore and Nemecek’s data:
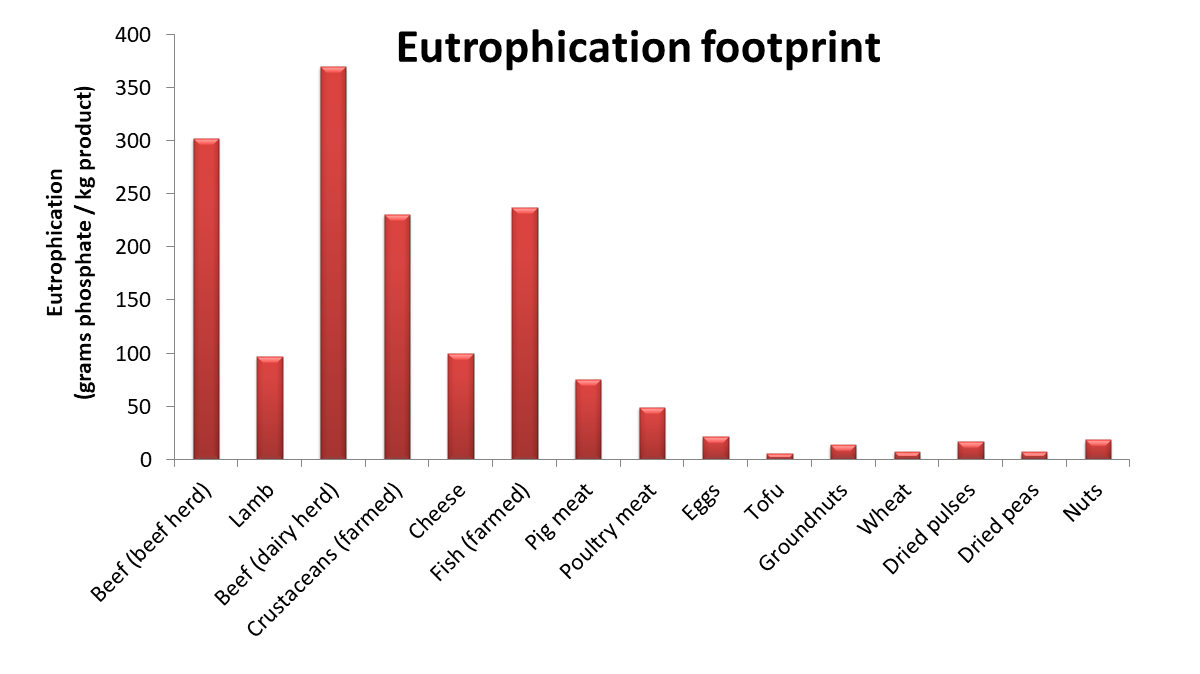
The animal-products – especially beef and farmed fish – all have considerably higher eutrophication footprints, compared to any of the plant products (including nuts). Eggs (and wild-caught fish, I think it’s safe to say) are again the best of the animal products, with cheese lagging behind.
Take note of the massive differences again – only 1 kg of beef causes the same amount of eutrophication as 43 kg of wheat/peas or 49 kg of tofu.
Acidification caused by meat and other foods
Acidification of soil and surface waters can reduce the ability of plants to germinate, form roots and thrive. This can undermine entire ecosystems and threatens our future food security. Here’s how the same set of foods compare in terms of how much acidification they cause:
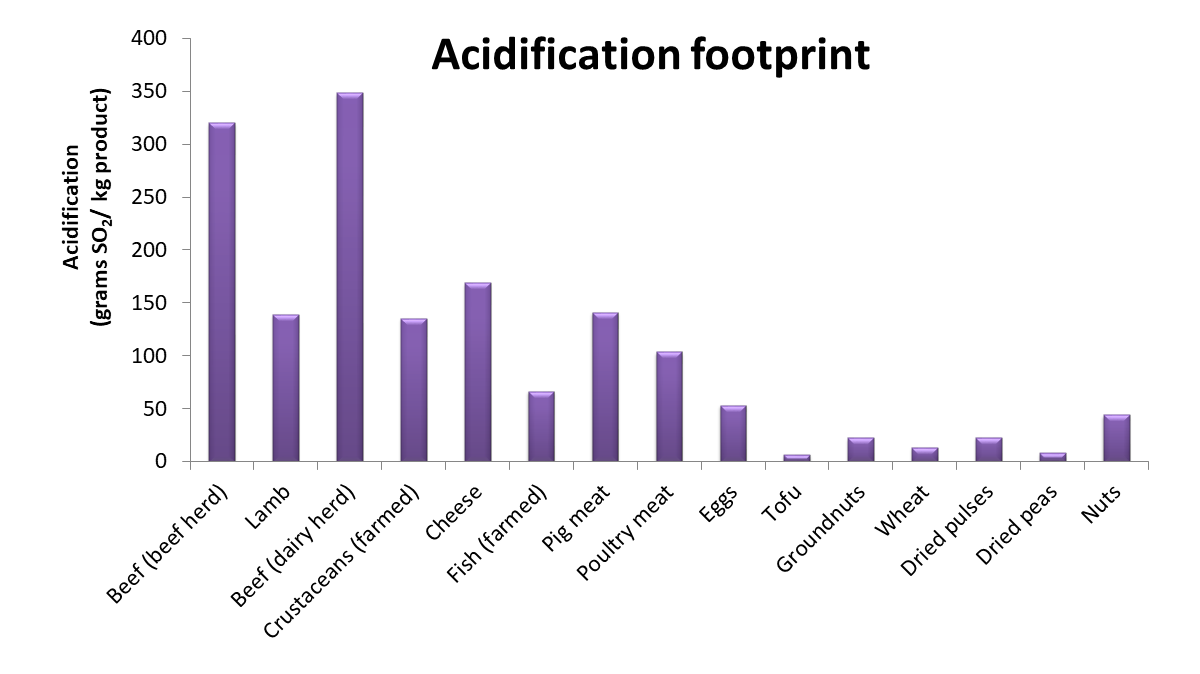
Again, the animal products have much higher acidification footprints than the plant products. Eggs look like the best option among the animal products again, and beef fares worst. Beef’s acidification footprint is 48 times higher than that of tofu and 39 times higher than that of peas.
Summary of environmental footprints: beef versus tofu
Here’s a graph summarizing the relative impacts of beef versus tofu. It’s worth taking a moment to recognize the scale of the differences – tofu’s footprint is only 1-3% of beef’s, in most cases. For example, it takes 100 times more land, on average, to produce 1 kg of beef compared to 1 kg of tofu. I’ll revisit this topic of land footprint in the next two blog posts, as it’s so critical to the future of the planet.
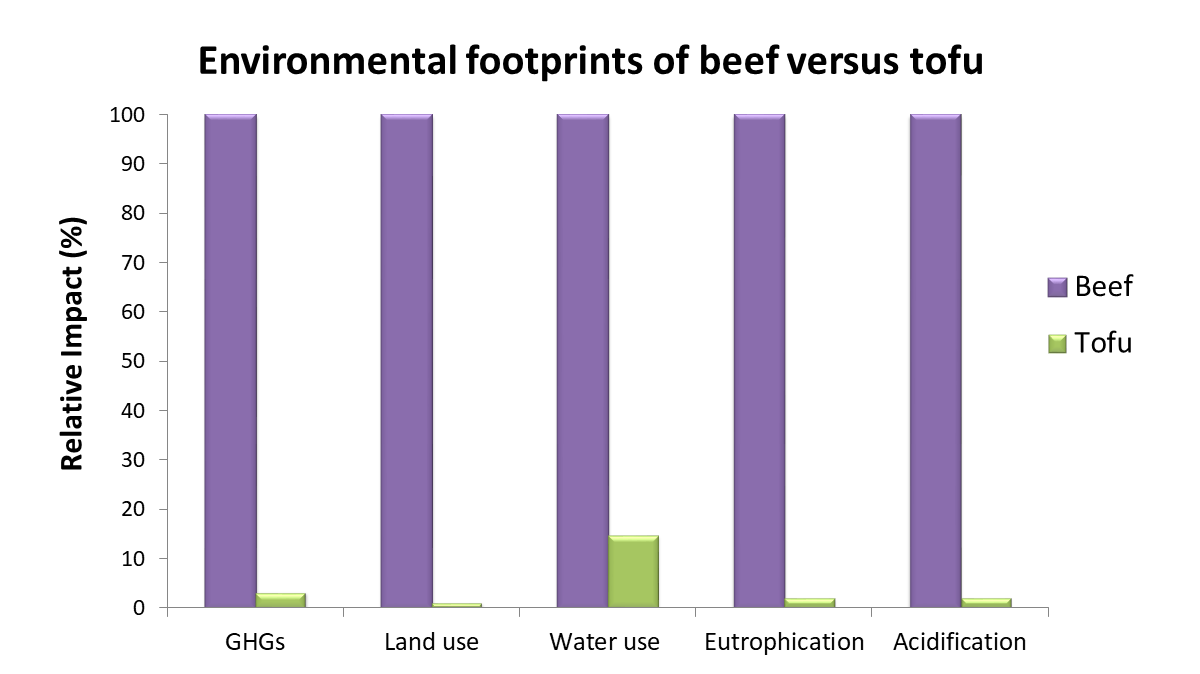
Similar trends are observed when we compare beef versus peas and other legumes, or even wheat. Whatever you eat, avoiding beef is the top dietary change you can make for the planet. Of the flesh-based foods, the best choices are poultry and (better again) certain kinds of sustainable seafood.
The other comparison that was most interesting for me (as a vegetarian that’s moving slowly towards veganism) is cheese versus eggs.
Summary of environmental footprints: cheese versus eggs
Cheese looks surprisingly bad for the environmental metrics examined here – worse than poultry meat in every case. If you consider the two main animal products for vegetarians, eggs have a much smaller footprint than cheese for every environmental metric examined by Poore and Nemecek, as shown below.
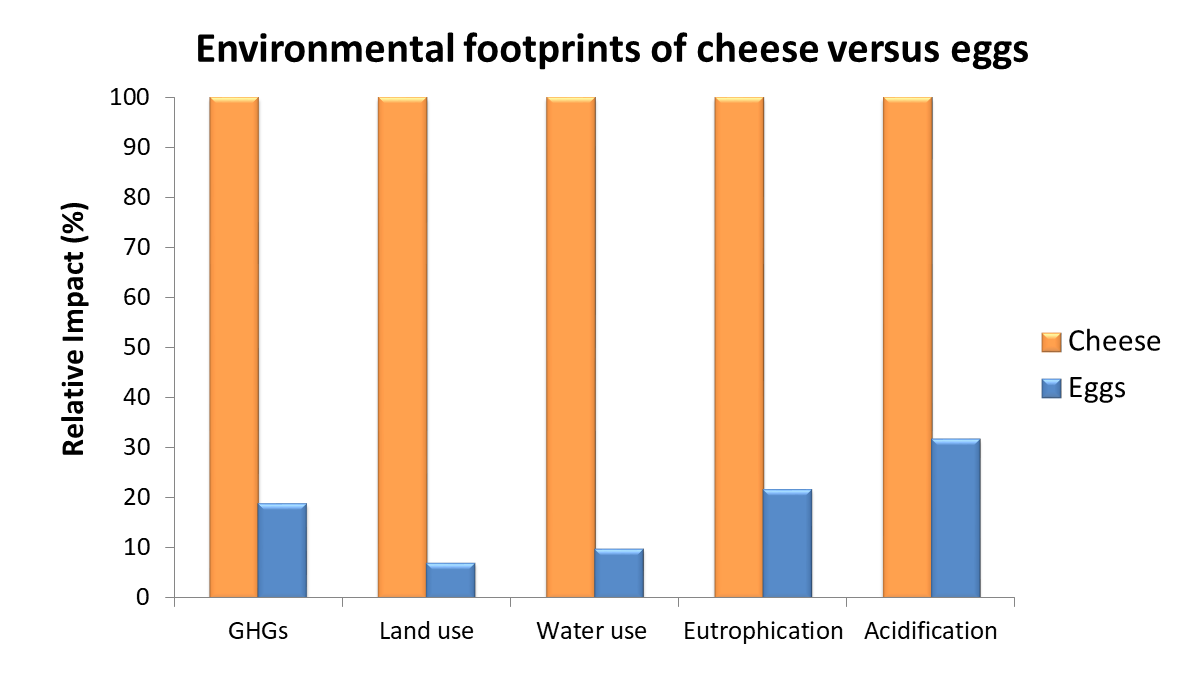
There are other ethical considerations, of course, and I’ll continue this discussion in a future post on the ethics of eggs. But all of the information above and everything else that I know so far on the ethics of dairy and eggs points me towards reducing cheese to a minimum and relying on eggs, if I have to choose between them.
Ok, I’ll leave it at that. Thank you for sticking with me and reading this far.
Feel free to post any questions or discussion points below.
To be continued!
Discover more from The Green Stars Project
Subscribe to get the latest posts sent to your email.

This was an insightful Sunday morning read. Some pieces are worth engaging your mind to its fullest.
LikeLiked by 1 person
Thank you! Glad you found it helpful.
LikeLike