
Stressed about global events? Feeling that you have no control over the fate of this world? There’s a lot to deal with on all fronts – sociopolitical and environmental. One the sociopolitical side, it certainly helps to vote for politicians who are mentally stable, logical, and non-xenophobic, because the world needs to calm down. (It’s election year again here in the US– yay!). We can also attempt to avert the deepening of societal fractures by trying to get along with each other as much as possible : ) Maybe Larry David will show us the way in the final season of Curb, coming up this weekend! (Unlikely)
If we look at the most serious threats to the planet on the environmental side, voting is again important – having people who care about the planet (and are mentally stable, etc.) at every level of government would be nice. Local and state governments can take important actions for the environment, regardless of whoever is president.
But, getting to the point, there is one action that we all need to take, and that’s to work on reducing our personal carbon footprints. If there were an Oscars for planetary threats, there is one threat that would sweep all the major awards:
- Biggest Impact. The global consequences will be huge!
- Most likely to happen. It’s already happening, folks!
- Most avoidable through individual action.
And the winner is….
Climate Change!
(No surprise there.)
If we could boil this individual action down to one immediate resolution, it would be to achieve a personal carbon footprint of 7 tonnes CO2 per year, or less.
This goal applies particularly to those in the top 10% of income earners, globally – more on that below.
Total and per-capita GHG emissions
Let’s look at how greenhouse gas (GHG) emissions break down across the human population. Different sources have slightly different estimates for annual global GHG emissions but perhaps the most reliable number is from the last major IPCC report, in 2022. That number is 59 billion tonnes of CO2 equivalents (usually written as CO2-eq). The term CO2 equivalents is used to represent all greenhouse gases – CO2, methane, etc., expressed as one single unit.
If we divide this number, 59 billion tonnes CO2-eq, by the human population, 8 billion people, we arrive at an average carbon footprint of 7.4 tonnes CO2-eq per person. But are we personally responsible for all of these emissions? Our personal actions and lifestyles are directly responsible for around 80% of global emissions and the remainder is due to infrastructure and government activities such as defense.* We are still indirectly responsible for those “administrative” emissions – we use the roads, public transit systems, water, libraries, hospitals, etc., and our votes will determine who gets into power and how they are likely to spend tax revenue.
So the bulk, but not all, of our global GHG emissions are due to our own direct actions as consumers. As a concession to the fact that it’s not 100%, I’ll round down our global average personal carbon footprint to 7 tonnes CO2-eq per capita although technically it should be a little lower than that.**
*In one key study on the carbon footprint of nations, our personal share of GHG emissions in the US is calculated to be 82% of total emissions, while the global average is 72%.
**If we want to meet the global average personal carbon footprint, then technically our goal in the US would be around 6 tonnes CO2-eq. That is, 82% of 7.4 tonnes, to exclude the footprints of government and infrastructure. However, 7 tonnes is already a challenging enough goal for many, so let’s stick with that for now.
Breakdown of GHG emissions by wealth & income
I found the table below to be interesting. It’s a division of the global population by income and wealth, from the 2022 World Inequality Report. Now you can finally see how you fit into the grand scheme of things! The report has lots of interesting data such as the number of billionaires on the planet (in 2021 there were 2582 billionaires, 159 people with more than $10 billion, and 9 people with more than $100 billion). For the rest of us, anyone earning over $40k (€37.2k) per year is in the top 10%, globally.
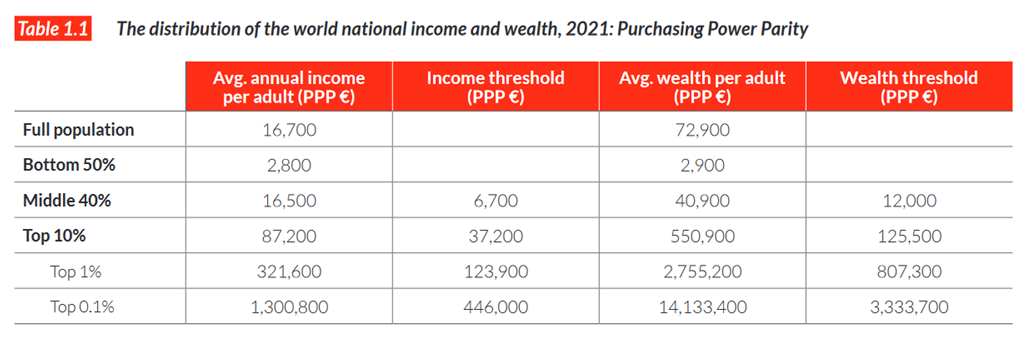
Now let’s take a look at how GHG emissions break down by income group, according to the World Inequality Report. Taking a look at the chart below, you can see that the top 10% of income earners contributed almost half (48%) of global GHG emissions. If you’ve made it into the top 1% (earning more than $135k per year) then know that this small group contributed 17% of GHG emissions. The “bottom half” of the global population – those who earned less than $7.3k (€6,700) annually – account for only 12% of GHGs.

The IPCC (sixth assessment synthesis report, 2023) paints a similar picture: “The 10% of households with the highest per capita emissions contribute 34–45% of global consumption-based household GHG emissions, while the bottom 50% contribute 13–15%.” How does this break down in terms of carbon footprint per person? Let’s take a look!
GHG emissions per capita: US versus Europe
So, as we already knew, the wealthier people generally have higher carbon footprints. Sticking with the data from the 2022 World Inequality Report (WIR) here’s a graph showing individual carbon footprints for a few regions, broken down by income level.

Of course, the most noticeable data point is the huge carbon footprint for the top 10% of earners in North America. But note how high the North American footprints are for every economic group – even the middle 40% of earners have carbon footprints not far off the wealthiest 10% of Europeans. If you’d like to get an idea of the average carbon footprint by country, you can try this map from Our World in Data.
The average carbon footprints in North America and Europe are 20.8 tonnes and 9.7 tonnes CO2-eq per person, respectively (WIR data). Before I do a post on this topic, please comment below on why you think the carbon footprints in the US and Canada are so much higher than those in Europe.
How to measure your carbon footprint
I’ve previously recommended the CoolClimate calculator for estimating your carbon footprint, and will stick to that recommendation. It’s the only carbon footprint calculator that has been peer-reviewed (as a science research publication). The CoolClimate developers, Dr. Chris Jones and Prof. Daniel Kammen, at UC Berkeley, have published studies on carbon footprints across the US as well as a specific temporal analysis of the San Francisco Bay Area.
I’ve spent some time looking at data on GHG emissions and per-capita carbon footprints to make sure that we can trust the numbers. There’s little point in recommending a carbon footprint goal or calculator unless the numbers behind them are solid. There’s a lot of variation in the literature, which is understandable since it’s such a complex topic but also frustrating because it’s such a crucial topic!
In their 2011 paper that introduced the CoolClimate calculator, Jones and Kammen state that the carbon footprint of the average U.S. household is 48 tonnes CO2-eq, which equates to roughly 20 tonnes CO2-eq per person, for 2005. In a 2020 report, Jones calculates a similar average carbon footprint (45.3 tonnes CO2-eq per household for 2015) suggesting that the per-capita US carbon footprint did not drop much over the decade.
The data from the Jones/Kammen and the World Inequality Report match quite well. Also, the last major report from the IPCC (AR6 WG3 report) calculates the per capita footprint for North America as 19 tonnes CO2-eq per person. The Our World in Data map, which is based on this 2023 Nature paper, states the average US footprint to be a little lower, at 17.6 tonnes CO2-eq per person. There is some variation in how carbon footprints are calculated but there is good agreement among the more trusted sources, including CoolClimate.
I highly recommend that everyone take some time to calculate their carbon footprint. This applies especially to anyone who lives in high-footprint countries (e.g., US, Canada, Australia) and/or who earns more than $40k (€37.2k) per year.
The immediate goal is to reduce your carbon footprint to the global average of around 7 tonnes CO2-eq.
But it doesn’t end there.
What should our carbon footprint goal be for 2030?
The IPPC has mapped out two goals for GHG emissions for 2030. To give us a 50/50 chance of limiting climate change to 1.5°C, we need to cut GHGs roughly in half: from the 59 billion tonnes of CO2-eqreleased in 2019, to 30 billion tonnes by 2030. If we aim for a less ambitious 2°C increase, then emissions should drop to 40 billion tonnes of CO2-eq.

The human population will be a little higher by 2030 (around 8.5 billion) so our ideal per capita carbon footprint goal would be 3.5 tonnes of CO2 per person to give us a chance of limiting warming to 1.5°C. If we assume, as above, that around 80% of GHG emissions are due to direct personal actions (and 20% due to infrastructure and government) then the personal footprint goal becomes 3 tonnes of CO2 (or around 4 tonnes per capita to limit warming to 2°C).
Stay tuned for an update on my earlier post on how to reduce your personal carbon footprint and, in the meantime, check out the post on calculating my own carbon footprint with CoolClimate.
Please comment below with your own experience with measuring your carbon footprint and limiting it to 7 tonnes.
Discover more from The Green Stars Project
Subscribe to get the latest posts sent to your email.

Thank you for sharing such clear and compelling contrasts among nations and groups within different income levels. It highlights the challenges ahead for achieving greater awareness of the global and environmental costs of privilege and inequity and then, securing the cooperation of the privileged classes and nations to make necessary changes.
LikeLiked by 1 person
Thank you Carol.
Yes, those with a comfortable level of income have the greatest need and yet the least excuses to change!
James
LikeLiked by 1 person