Most of us have wondered about water usage at some point, skimming articles about saving water at home or the water footprints of things like jeans, nuts, meat, etc. What are the best ways to reduce your water footprint? How important is it, in the great scheme of things?
Well, I’ll answer that second question first. Of the nine planetary boundaries, freshwater use is one of six that has been transgressed. On a global level, it’s not quite as severe as some of the other planetary boundaries such as climate change and land use change. But it’s clearly severe in some regions – especially when we look at availability of blue water.
Blue versus green water
Blue water is basically water that’s piped from reservoirs, to be used at home, on farms, in industry, etc. Green water is rain (or snow) that falls out of the sky and is absorbed by the soil and plants. Here’s a more exact definition from a 2020 paper on the water footprint of nuts:
Blue water refers to water in rivers, lakes and aquifers. Green water is the soil water held in the unsaturated zone, formed by precipitation and available to plants. Irrigated agriculture receives blue water (from irrigation) as well as green water (from precipitation), while rain-fed agriculture receives only green water.
When we think about water scarcity, the blue water footprint is often considered to be more critical than green water. Rain-fed organic cotton has a lower blue water footprint than industrial cotton that requires large quantities of piped water for irrigation. The amount of blue water used becomes critical when water is scarce in that region – for example, in India where much of our cotton is grown.
The water consumed to grow India’s cotton exports in 2013 would be enough to supply 85% of the country’s 1.24 billion people with 100 litres of water every day for a year. Meanwhile, more than 100 million people in India do not have access to safe water. – The Guardian.
So we need to factor in what kind of water is being used (blue versus green) but also water scarcity in the region of use.
Factoring scarcity into the water footprint
In 2018, an international team of scientists published a standardized method (called AWARE) for assessing the impact of water consumption based on available water remaining. In other words, they address the question: What is the potential to deprive another user (human or ecosystem) when consuming water in this area?
This amounted to a model (shown in the map below) that allows researchers to consider water scarcity when conducting life-cycle assessments (LCAs) to determine the water footprint.

Its common sense, really, and it allows us to make more meaningful calls on water footprints. For example, hazelnuts grown in Oregon are less likely to create a water shortage than almonds grown in California (or butter from Ireland, compared to butter from Spain).
The highest rates of groundwater depletion are in regions of high agricultural production such as northwest India, northeast China, northeast Pakistan, California’s central valley, and the Midwest of the USA. – Safeguarding human health in the Anthropocene epoch (2015)
The blue water footprint of foods
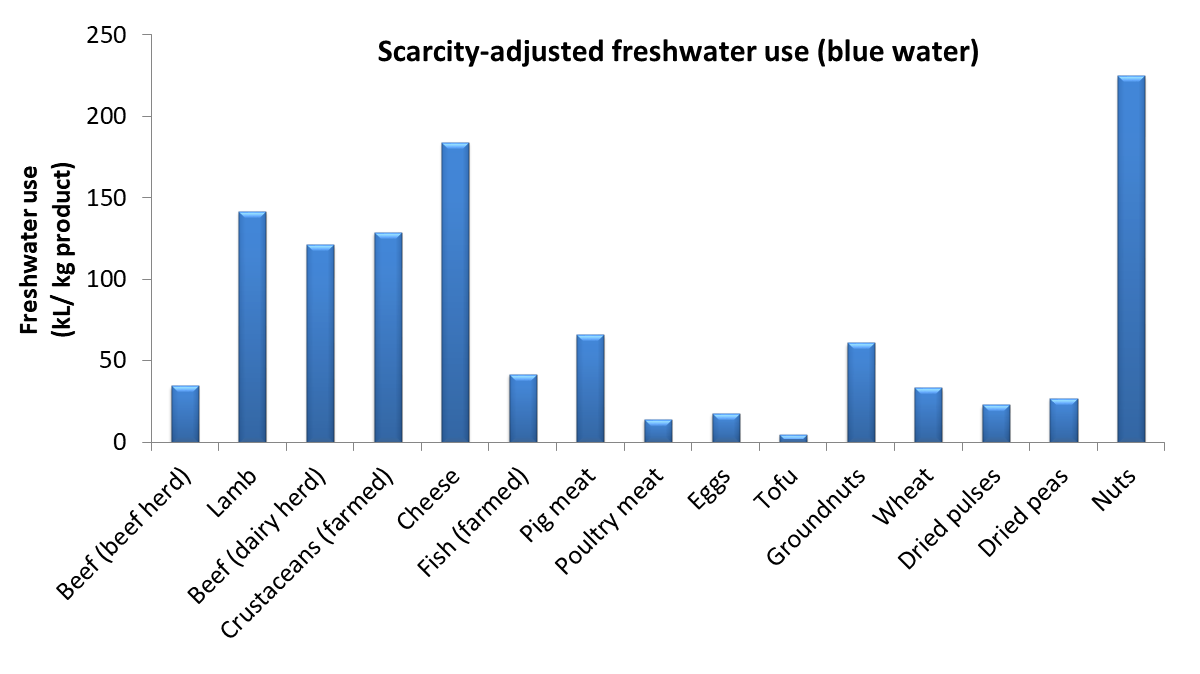
This AWARE model was used by Oxford University scientists Poore and Nemecek in their seminal paper (covered recently on the GSP) on the environmental footprints of various foods. I’ll briefly revisit this data, to show the difference between the absolute blue water footprints versus the footprints after adjustment for water scarcity. As you can see on the chart below, producing 1 kg of beef takes 1,500 liters of blue water, on a global average. 1 kg of nuts takes 4,000 L and 1 kg of cheese has the highest footprint, at 5,600 L.

When water scarcity is factored in (see the second chart, below) then nuts overtake cheese to take the top position. Beef and lamb have similar absolute blue water footprints (above) but when scarcity is considered then lamb’s footprint becomes four times higher than beef’s (below). If you go back to the water scarcity map, above, you’ll see that some major beef producers (e.g., Brazil) are less water-stressed than some lamb-producing countries (e.g., Australia).
But this also serves to highlight that water use is not the only environmental footprint – in general, beef has larger carbon and water pollution footprints than lamb. Then, more specifically, beef sourced from Brazil is more likely to be cause deforestation than lamb from Australia. Similarly, nuts have a larger blue water footprint than beef, but are way better on all other major environmental metrics – carbon footprint, land use, water pollution and acidification.
I focused on protein-rich foods here as they generally have the largest water footprints, among the foods.* But the reason I focused on food in general is because agriculture is responsible for more of our scarcity-weighted water use.
*It is worth mentioning one non-protein food that has a high water footprint: olive oil. One liter of olive oil has around the same scarcity-weighted footprint as 1 kg of cheese.
Where do we use the most water?
Across the planet, around 13% of blue water is used domestically, 15% industrially, and most of the remainder is used for agriculture. Water used industrially and domestically has a higher rate of return to aquifers (after treatment) compared to water used for agriculture. Also, water used for agriculture tends to be also used during water-scarce months and in water-scarce areas. Here’s how Poore and Nemecek described it:
We estimate that two-thirds of freshwater withdrawals are for irrigation. However, irrigation returns less water to rivers and groundwater than industrial and municipal uses and predominates in water-scarce areas and times of the year, driving 90 to 95% of global scarcity-weighted water use
So agriculture is the big one, but that’s not to say that we shouldn’t be conserving water in every way possible. Let’s take a look at a common method for examining our personal water use – a water footprint calculator.
Total water footprint calculators
This is where things can get confusing – many of the online guides to water footprints don’t make it clear what kind of water use they are talking about. If it’s not specified, you should assume that they are dealing with total water use – blue and green water. Most internet searches lead to some version of the Water Footprint Calculator, which deals with total water use (blue + green). This should have been explained on the site or, even better, the blue and green footprints should be shown separately.
For example, the total water footprint of beef – green plus blue water – is stated by the Water Footprint Calculator and many other sources to be around 15,000 liters per kg of meat. That’s around 10 times higher than the blue water footprint (in the first chart, above) because most of the water that goes into beef is green water – rainfall on pasture or crops used for feed. It’s also higher than the total water footprint of most treenuts, such as almonds and pistachios.
The Water Footprint Calculator is based on data from the late Prof. Arjen Hoekstra, who pioneered the concept of the water footprint. His argument for looking at total water use (blue + green) is that rainwater is also a limited resource and therefore we should consider both. It’s certainly true that all the rainfall that goes into producing products like beef could be used to water crops instead, if that land was used differently. (As we saw in the post on the environmental footprints of protein-rich foods, beef has a shockingly high land footprint.)
On the whole, it’s frustrating that these calculators don’t differentiate between blue and green water but it can be useful to look at total water usage. Previously, in fact, only blue water was monitored by the planetary boundaries scientists, but green water was added as a new metric in their 2023 paper, discussed in the recent GSP post.
So let’s take a look at the total water footprint of a US resident.
Typical domestic water footprint
You’ll get the most out of using the Water Footprint Calculator if you try different responses to each question and see how they impact your footprint (the running total is shown on the lower left). As I was about halfway through calculating mine, I could see that my water footprint tally was only around 50 gallons (190 liters) of water per day. Then I answered the question about shopping habits (other than food) and, even though I selected the lowest level of shopping (just the basics), this added 291 gal. (1100 L), eclipsing my domestic water use.
But then shopping was in turn eclipsed by diet. If I report my diet as vegetarian then this adds 563 gal (2100 L) to my footprint. For a meat eater (who eats meat twice a day) the water footprint for diet becomes 939 gal (3600 L) per day.
The final footprint is displayed as a chart and also as a table that compares your values to the US average. Here’s a sample water footprint chart, which I’ve annotated to show where most water is typically used:

The US average water footprint is 1,800 gallons/day (6,800 liters/day), with most of that coming from diet and other shopping habits. But, as discussed earlier, this is total water usage – blue and green water mixed together. Domestic water use doesn’t look like much, at first, but consider that 100% of it is the more scarce resource of blue water.
So it’s certainly worth conserving water at home – especially if you live in an area that’s prone to water scarcity. Having a low-water garden is the best way to do this, but low-flow toilets and shower heads are also worthwhile. Many approaches that save energy also save water, such as only running your washing machine when you have a full load and minimizing electricity use (electricity production takes water).
But the biggest contributions to your water footprint are almost certainly your diet and your shopping habits.
The water footprint of the stuff we buy
Here are some examples (from the Water Footprint Calculator blog) of the total water footprint (blue + green) of items that are commonly discussed when it comes to water use:
- Beef, consumed three times a week: 390,000 L per year
- Salad, consumed three times a week: 12,500 L per year
- New car: 52,000-83,000 L
- Smart phone: 13,000 L
- Pair of jeans: 11,000 L
- Cotton T-shirt: 2,500 L
Most of the data here comes from studies published by Prof. Hoekstra and colleagues, except for the water footprint of a new car (which is from this source). Incidentally, a large part of the water footprint of a car is from the production of iron, steel, and precious metals, which are water-intensive.
This all seems tidy and helpful but there are some issues that should be pointed out. First, as discussed above, lumping blue and green water together is not as helpful as considering them separately. Second, local water scarcity is not considered in many of these studies. Third, the water footprint, as calculated by different groups, often differs quite a lot. For example, the 11,000 liter footprint of a pair of jeans listed above is higher than other estimates (4,000-5,000 L).
In spite of these problems, there is still an overall consensus: agriculture is the greatest user of our water (both blue and green). The food we consume quickly adds up to a large water footprint. Not a lot people buy a new car every year (~ 67,000 L) but many do eat beef three times a week (390,000 L) – and that’s only a portion of their food intake.
Looking at blue water alone, Poore and Nemecek agree that agriculture is the big one, concluding that irrigation drives 90 to 95% of global scarcity-weighted water use. I like their data set (the two bar carts at the start of this post) for various reasons. They consider water scarcity, allowing us to look at the absolute amount of blue water used and also the scarcity-weighted amount. Their data also passes a basic fact-check, in that total water usage matches their calculations of water footprint per kg multiplied by total production (kg).
Key actions for reducing your water footprint
So, reducing water use in our homes and especially our gardens is important. We should also learn to resist those consumerist urges (in the voice of Father Ted) and to buy second-hand stuff when possible. For new clothing purchases, seek out sustainable textiles (linen, hemp, Tencel, Lyocell, organic/rain-fed cotton, and some recycled fabrics).
But the most effective way to reduce our water footprint is by changing our diet. By reducing consumption of just a few key foods we can significantly reduce water usage.
For scarcity-weighted freshwater withdrawals, the skew is particularly pronounced: Producing just 5% of the world’s food calories creates ~40% of the environmental burden. – Poore and Nemecek, 2018.
To minimize water use, while also taking into account the other environmental footprints of food, we should reduce consumption of animal products above all else. If your diet (or your pet’s diet) does include some animal products then the best choices include wild fish (small pelagic fish, salmonids), farmed bivalves, eggs, and chicken.
Our diets should lean into legumes (lentils, tofu, split peas, peanuts, etc.) and include tree nuts (which have large water footprints but bring other environmental benefits) in moderation. And I forgot to even mention* fruit and veg because they have such low water footprints (and other footprints too) – so go crazy with them!
*As usual, we ignore the nice guys!
Discover more from The Green Stars Project
Subscribe to get the latest posts sent to your email.

Guess my water footprint is much higher than I thought. As a vegetarian, nuts are an important source of protein.
LikeLike
Hey Rosaliene,
Nuts do have a high water footprint, but this is offset by the lower carbon, land and pollution footprints. See my earlier post on the environmental footprints of protein-rich foods for charts on all footprints. So, on balance, nuts are fine when consumed in moderation. Groundnuts (e.g., peanuts) are better than tree nuts, so mix some peanuts in if you’re not allergic to them! Among the treenuts, chestnuts are great if you have access to the edible variety of chestnuts, and walnuts or hazelnuts tend to have lower water footprints compared to, say, cashews.
Thanks for the comment!
James
LikeLiked by 1 person
Appreciate the info, James 🙂
LikeLiked by 1 person